Overview
This project presents real-time Jackson Hole mountain conditions in a calm, readable dashboard for wall-mounted displays. The application runs as a small standalone web server instead of being coupled to a larger site, making it practical for a dedicated signage device.
Key Features
- Fetches Jackson Hole public XML snow report data through a Node.js backend.
- Parses and serves summit base depth, season snowfall, lifts, trails, summit temperature, and daily weather.
- Polls the XML feed on the backend every 60 seconds and refreshes the front end every 30 seconds.
- Uses high-contrast typography, large metric panels, and alpine imagery for viewing across a room.
- Runs with plain HTML, CSS, and JavaScript on the front end with no build step.
Evidence
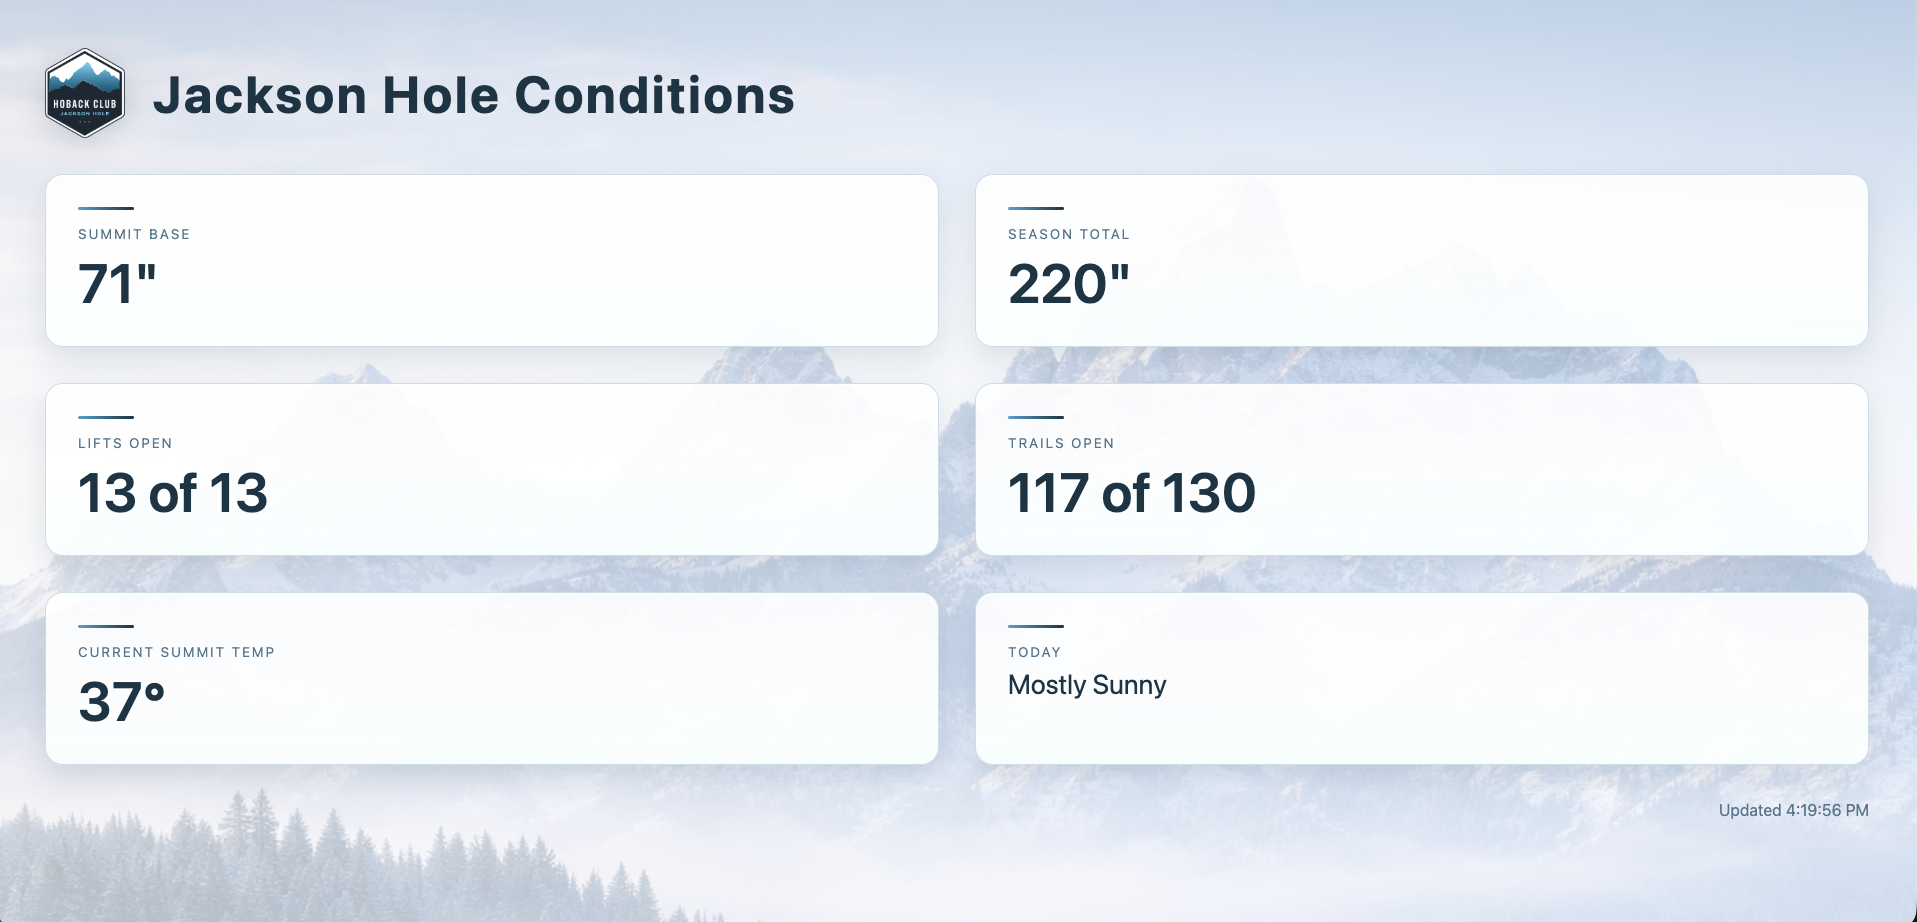
The dashboard screenshot shows the signage layout: logo and title, large metric cards, live weather values, mountain background imagery, and a last-updated timestamp.
What I Learned
The project strengthened my experience with small production-style Node.js services, XML data ingestion, defensive fallback values, and interface design for non-desktop environments where readability and unattended operation matter more than dense interactivity.